Aerial view of a petroleum refinery and terminal complex with tank farm and processing units.

Industrial digital transformation

Run your terminal as one connected operating chain.

The full digital backbone of oil terminals and fuel depots across Africa and MENA — ERP, TAS, SCADA, PLC, safety and Digital Twin.

Sbridge operating chainA simplified operating chain linking ERP, TAS, SCADA, PLC, safety, field equipment, and digital twin workflows.ERPTASSCADAPLCTwin

Why Sbridge

A practical bridge between operations and digital systems.

Connect

Join business systems, terminal automation, and field data into one operating chain.

Automate

Make loading, stock, controls, and safety handoffs consistent across shifts.

Optimize

Turn operating data into decisions on throughput, reliability, and traceability.

Trusted across the operating chain

Operators our team has worked with

Sonangol Distribution — Angola
Puma Energy
Botswana Oil
OVH Energy — Nigeria

Technologies and systems we integrate with

Guidant Measurement
IOVision
SATAM S.A.S
SAP
Microsoft Dynamics
Oracle

Engineering and field partners
IPEM
Toprope
Siemens

Company names, trademarks and logos are the property of their respective owners. Use does not imply endorsement, partnership, certified-integrator status or any current commercial relationship unless contractually documented. FuelFACS is a trademark of Guidant Measurement. Sbridge provides independent FuelFACS services.

One integrated chain

From ERP order to Digital Twin, one integrated chain.

The operating chain is where business intent, automation logic, field reality, and management visibility meet. Sbridge designs those handoffs before implementation starts.

The Sbridge Operating Chain A vertical flow diagram showing the ten layers of the integrated terminal operating chain, from ERP at the top through TAS, access control, pump and valve actuation, metered loading, safety protection, real-time inventory, billing reconciliation, digital twin and KPI scorecard at the bottom. The layers are connected by animated cyan flow lines indicating bidirectional data exchange. The Sbridge Operating Chain — ENTERPRISE — TAS & ACCESS — FIELD CONTROL & SAFETY — INTELLIGENCE 1. ERP — Sales orders, customer master, product master, billing triggers 1 ERP Order & master 2. TAS — Terminal Automation System 2 TAS FuelFACS / equiv. 3. Access — Driver and Vehicle Authorization 3 Access Driver / vehicle 4. Pump & VFD — Pump, Valve and VFD Control 4 Pump & VFD PLC actuation 5. Loading — Loading and Metering 5 Loading Metering / BOL 6. Safety PLC — ESD and overfill protection 6 Safety PLC ESD / overfill 7. Inventory — Real-time tank gauging and stock 7 Inventory ATG / stock 8. Billing — Billing and Reconciliation 8 Billing Reconciliation 9. Digital Twin — OptiLoad™ scenario engine 9 Digital Twin OptiLoad™ 10. KPI Scorecard — Operations dashboard 10 KPI Scorecard From ERP order to KPI scorecard — one connected operating chain. Data flows bidirectionally between every layer.

ERP and orders

Business intent, master data, stock movements, accounting, and billing.

TAS and loading

Authorization, bay workflow, access control, loading records, and reconciliation.

Field and safety

Pumps, valves, meters, PLC logic, permissives, interlocks, and overfill protection.

Inventory and KPI

Tank stock, billing closure, Digital Twin scenarios, and operating scorecards.

Outcomes

What changes when the chain is connected.

Truck turnaround becomes visible

Gate, bay, loading, and exit events can be measured as one operational flow.

ERP and TAS variance closes

Confirmed movements and business records can be reconciled with fewer manual gaps.

Stock visibility becomes real-time

Tank, movement, and order context can be seen together by operations teams.

Loss and theft become harder to hide

Access, loading, and inventory events become traceable across systems.

Safety events are clearer

ESD, interlock, alarm, and permissive states become part of the operating record.

Pump energy can be tuned

VFD-aware control patterns make pump behavior visible and adjustable.

Indicative outcomes only. Actual results are scoped per terminal and supporting data.
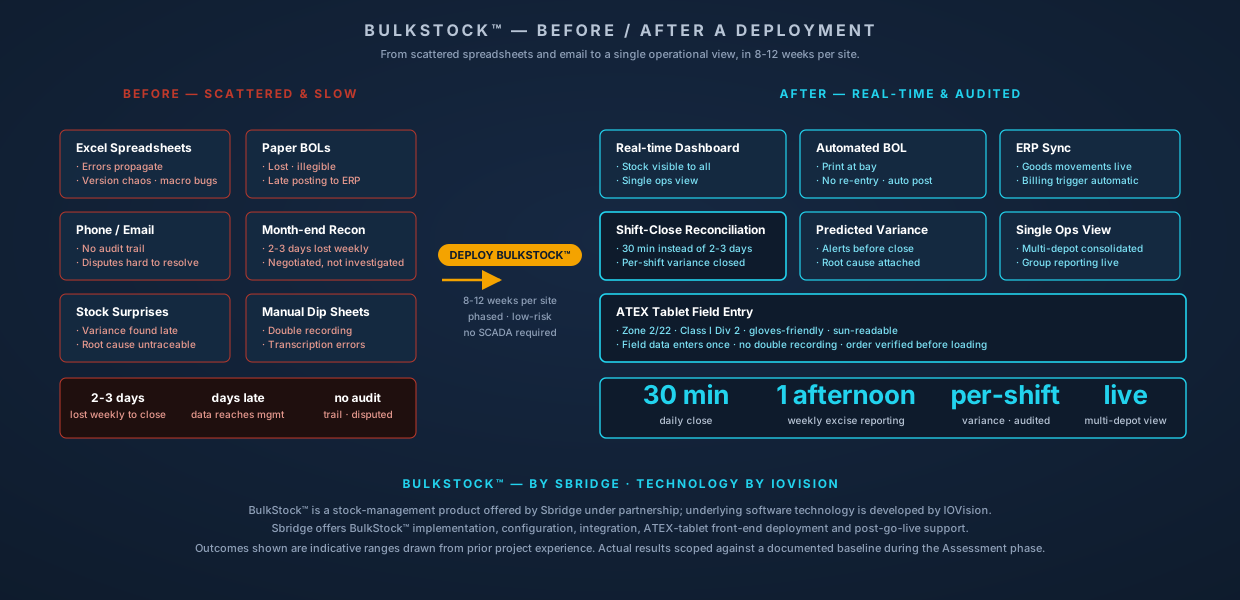
Before-and-after diagram contrasting manual terminal operations with spreadsheets and paper against an automated connected system with real-time dashboards.

Representative scenarios

From projects we have participated in.

West African coastal terminal

Challenge

Multiple handoffs between business orders, loading control, and stock records.

Solution

Map ERP, TAS, and field events into a shared operating-chain view.

Outcome

A clearer path for reconciliation, shift review, and phased modernization.

Southern African inland depot

Challenge

Lean operations team needed better stock confidence and movement traceability.

Solution

Define BulkStock™ entry points around depot movements and daily controls.

Outcome

A practical roadmap for inventory visibility without replacing every system at once.

Multi-product tank farm

Challenge

Planning decisions depended on disconnected reports and manual checks.

Solution

Model constraints with a digital twin and expose KPI signals for operations.

Outcome

Better scenario review before changes reached live yard operations.

Talk to us

Map your operating chain. We will show you where time, money, and traceability are leaking.

A focused discovery call gives you a practical view of the systems, field signals, and operating handoffs that deserve attention first.

We reply within two business days.