
Terminal Performance

Operational visibility for every shift.

Expose bottlenecks, delays, and throughput patterns with operational dashboards and KPI discipline.

Talks to

KPISCADATASERP

Operating chain view

1KPI
2SCADA
3TAS
4ERP

What we cover

A focused scope before implementation starts.

01

KPI library & definition

02

Data source mapping & quality

03

Dashboard design & reporting cadence

04

Continuous improvement & BulkStock™ / Digital Twin integration
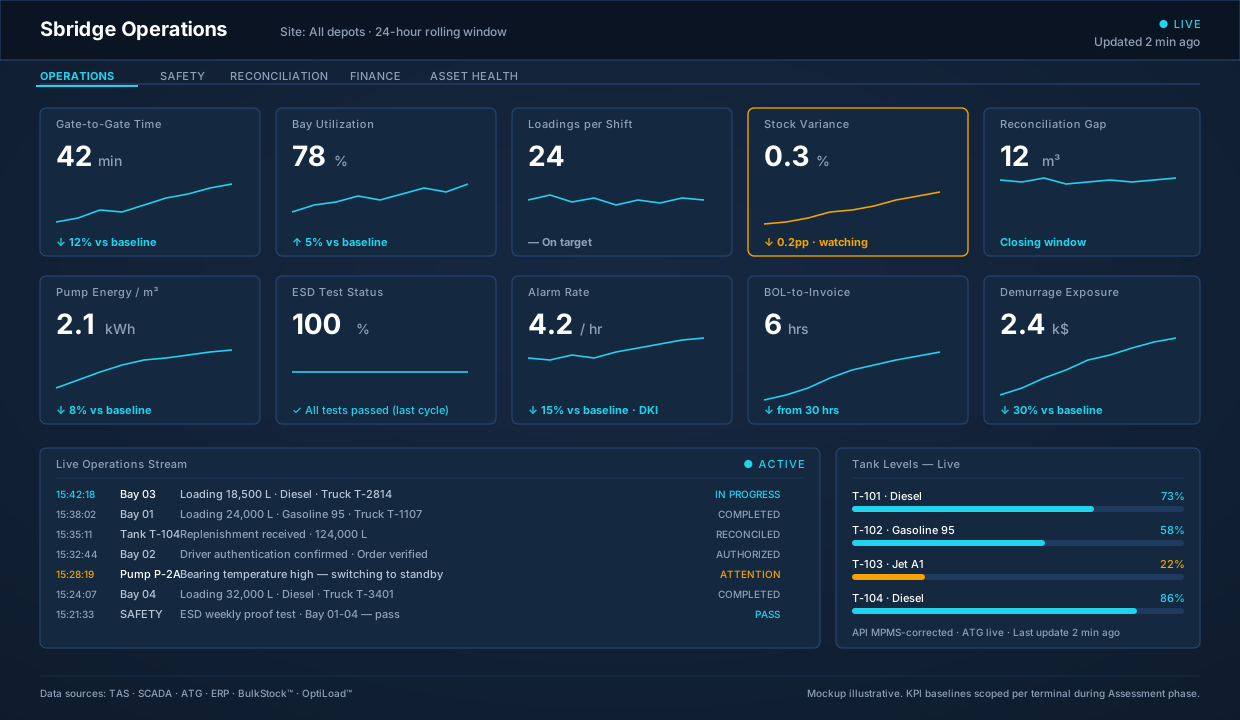
KPI dashboard mockup showing ten performance cards for terminal operations on a dark interface.
The numbers your operations team should see every morning.

Scope and outcomes

What we deliver — and what it changes.

Technical work that turns events into reviewable KPIs.

  • Gate-to-gate time — from truck arrival at gate to exit with BOL.
  • Bay utilization — percentage of available bay-minutes used for productive loading.
  • Loadings per shift — throughput volume and transaction count per operating shift.
  • Stock variance % — difference between physical stock, TAS inventory, and ERP book stock.
  • Reconciliation gap — ERP vs TAS vs physical variance trended over time.
Show all 13 items
  • Pump energy per m³ — energy efficiency metric for pumping operations.
  • ESD test status — proof-test compliance, overdue tests, and bypass status.
  • Alarm rate — alarms per hour/day with prioritisation and flood detection.
  • Lost-time loadings — loadings delayed or cancelled due to equipment, system, or process issues.
  • Demurrage exposure — queue time and truck waiting cost estimated from event data.
  • BOL-to-invoice cycle time — elapsed time from loading completion to customer invoice.
  • Custody-transfer drift — meter-factor deviation and recalibration triggers.
  • Driver/vehicle authorization rate — percentage of loadings with valid, pre-authorised driver and vehicle credentials.

Representative scenarios

From projects we have participated in.

West African coastal terminal

Challenge

Multiple handoffs between business orders, loading control, and stock records.

Solution

Map ERP, TAS, and field events into a shared operating-chain view.

Outcome

A clearer path for reconciliation, shift review, and phased modernization.

Southern African inland depot

Challenge

Lean operations team needed better stock confidence and movement traceability.

Solution

Define BulkStock™ entry points around depot movements and daily controls.

Outcome

A practical roadmap for inventory visibility without replacing every system at once.

Multi-product tank farm

Challenge

Planning decisions depended on disconnected reports and manual checks.

Solution

Model constraints with a digital twin and expose KPI signals for operations.

Outcome

Better scenario review before changes reached live yard operations.

FAQ

Questions to settle before scope hardens.

Standards we engineer to:

API MPMS · API 2350 · API RP 14C · IEC 61508 · IEC 61511 · IEC 62443 · IEC 60079 · ATEX · MID · ISO 28000 · NFPA 30 · Shell DEP

Talk to us

Map your operating chain. We will show you where time, money, and traceability are leaking.

A focused discovery call gives you a practical view of the systems, field signals, and operating handoffs that deserve attention first.

We reply within two business days.